Analyzing the Reflected Light off Tesla Roadster in Space
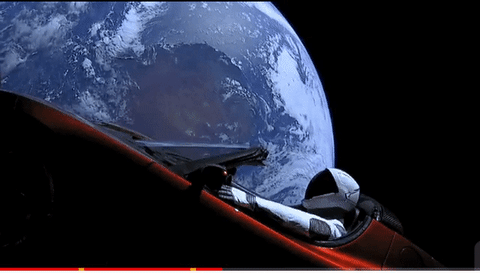
In Feb. 6, 2018, SpaceX launched Falcon Heavy with a Tesla Roadster with a dummy driver called Starman towards Mars's direction.
In Feb. 10, Erik Dennihy and JJ Hermes used the 4.1-meter SOAR telescope in CTIO, Chile to monitor its brightness for about 1 hour. JJ Hermes posted a tweet showing the light curve (brightness of object as function of time) of Starman. A video of the actual footage is here.
Hanno Rein et al. also posted a hilarious at first but insightful paper in ArXiv entitled The random walk of cars and their collision probabilities with planets. In this study, they ran N-body simulations using a large ensemble of simulations with slightly perturbed initial conditions, and estimated the probability of a collision of the Tesla roadster with Earth and Venus over the next one million years to be 6% and 2.5%, respectively. Cool right?
But anyway, in this post, we aim to confirm whether the Tesla Roadster (a.k.a. Starman, 2018-017A) is indeed rotating with a period of 4.7589 +/- 0.0060 minutes.
First, let's download data from here directly using pandas. The first column is time in seconds, and the second column in relative flux (or brightness of object per unit area).
import pandas as pd

link = 'http://k2wd.org/share/roadster.dat'
data = pd.read_csv(link, delimiter=' ', comment='#')
data.columns = ['Time','Flux']
- inspect data
data.head()
From the data above, we can see that each measurement was taken in every 15 seconds.
%matplotlib inline

#styling
%config InlineBackend.figure_format = "retina"
from matplotlib import rcParams

rcParams["savefig.dpi"] = 100
rcParams["font.size"] = 20
import matplotlib.pyplot as pl

t=data.Time
f=data.Flux

fig,ax = pl.subplots(1,1,figsize=(15,3))
ax.plot(t,f,'o-')
ax.set(xlabel='Time [sec]',
       ylabel='Relative Flux');

Finding period
from gatspy.periodic import LombScargleFast

model = LombScargleFast().fit(t, f)
periods, power = model.periodogram_auto(nyquist_factor=100)

fig, ax = pl.subplots()
ax.plot(periods, power)
ax.set(xlim=(0, 500), ylim=(0, 1),
       xlabel='period (second)',
       ylabel='Lomb-Scargle Power',
       title='Periodogram');

The highest peak of the periodogram corresponds to optimum period.
import numpy as np

idx=np.argmax(power)
period in seconds
p=periods[idx]
p
period in minutes
p/60
#built-in optimizer
model.optimizer.period_range=(250, 300)
period = model.best_period
print("period = {0}".format(period/60))
Phase-folding
Let's fold the light curve and see how much the brightness varies during each period
phase = (t / period) % 1

# Compute best-fit template

phase_fit = np.linspace(0, 1, 1000)
f_fit = model.predict(period * phase_fit, period=period)

# Plot the phased data & model
fig, ax = pl.subplots()
ax.plot(phase, f, '.k', alpha=0.5, label='data')
ax.plot(phase_fit, f_fit, '-r', lw=3, label='model')
ax.set(xlabel='Phase',
       ylabel='flux',
      title='Phase-folded light curve');
ax.legend()

scipy's optimizer
def simple_sine(theta, t):
    """assumes light curve is sinusoidal"""
    a, b, c = theta
    return a * np.sin(b * t + c)

def lnlike(params, t, f):
    """model's ln likelihood"""
    m = simple_sine(params[:3], t)
    sig = params[3]
    resid = f - m
    inv_sigma2 = 1.0/(sig**2)

    return -0.5*(np.sum((resid)**2*inv_sigma2 - np.log(inv_sigma2)))


def lnprob(theta, t, f):
    """ln probability = ln like+ln prior"""
    #prior
    if np.any(theta < 0):
        return -np.inf

    #loglike
    ll = lnlike(theta, t, f)
    return ll if np.isfinite(ll) else -np.inf

nlp = lambda *args: -lnprob(*args)
import scipy.optimize as op

init_guess = (0.1,6,0.1,0.1) #amplitude, phase, lag, uncertainty in flux
args = (phase, f)

opt = op.minimize(nlp, init_guess, args=args, method='nelder-mead')
print(opt.success)
for i in opt.x:
    print ("parameter optimum: {:.4f}".format(i))
Plot optimized fit
# Plot the phased data & model
fig, ax = pl.subplots()

ax.plot(phase, f, '.k', alpha=0.5, label='data')
ax.plot(phase, simple_sine(opt.x[:3], phase), 'ro', lw=3, label='model')
ax.set(xlabel='Phase',
       ylabel='flux',
      title='Phase-folded light curve');
ax.legend()

h = lambda x,a,b,c: a*np.sin(b*x+c)

p_opt, p_cov = op.curve_fit(h, phase, f, p0=init_guess[:3])
var = np.diag(p_cov)
std = np.sqrt(np.diag(p_cov)) #a.k.a. sigma

for i,j in zip(p_opt, std):
    print ("parameter optimum: {:.4f} +/- {:.4f}".format(i, j))
pl.matshow(p_cov)

# Plot the phased data & model
fig, ax = pl.subplots()

ax.plot(phase, f, '.k', alpha=0.5, label='data')
ax.plot(phase, h(phase, *p_opt), 'ro', lw=3, label='model')

for i in range(100):
    theta = p_opt + np.random.randn(p_opt.size) * std
    pl.plot(phase, h(phase, *theta),'ro', lw=3, alpha=0.1)

ax.set(xlabel='Phase',
       ylabel='flux',
      title='Phase-folded light curve');
#ax.legend()

MCMC
Use markov chain monte carlo with ensemble sampler to explore parameter space and quantify uncertainty.
from emcee import EnsembleSampler
from emcee.utils import sample_ball
from tqdm import tqdm

# initial = opt.x

ndim = len(init_guess)
nwalkers = 8 * ndim
nsteps1 = 500
nsteps2 = 3000

sampler = EnsembleSampler(nwalkers, ndim, lnprob, args=args, threads=1)
pos0 = sample_ball(init_guess, [1e-1]*ndim, nwalkers)

width = 30
print("\nstage 1")
for pos,_,_ in tqdm(sampler.sample(pos0, iterations=nsteps1)):
    pass
print("\nstage 2")
idx = np.argmax(sampler.lnprobability)
best = sampler.flatchain[idx]
pos0 = sample_ball(best, [1e-5]*ndim, nwalkers)
sampler.reset()

for pos,_,_ in tqdm(sampler.sample(pos0, iterations=nsteps2)):
    pass
chain = sampler.chain
labels = ['${}$'.format(i) for i in r'A,\theta,\phi,\sigma'.split(',')]
fig, axs = pl.subplots(ndim, 1, figsize=(15,ndim), sharex=True)
[axs.flat[i].plot(c, drawstyle='steps', color='k', alpha=4./nwalkers) for i,c in enumerate(chain.T)]
[ax.set_ylabel(labels[i], fontsize=20) for i,ax in enumerate(axs)]
fig.tight_layout()

chain.shape
#flatten the chain
fc = np.reshape(chain,(-1,ndim))
Measure autocorrelation needed to ensure independent sampling.
from acor import acor

taus = []
for i in range(ndim):
    j = fc[:,i]
    tau,_,_ =acor(j)
    tau = int(round(tau))
    taus.append(tau)
    print('tau={}\t ndata={}'.format(tau,len(j[::tau])))
joint and marginal distributions
from corner import corner

hist_kwargs = dict(lw=2, alpha=0.5)
title_kwargs = dict(fontdict=dict(fontsize=12))

fig = pl.figure(figsize=(8,8))

corner(fc, labels=labels, #truths=truths,
       hist_kwargs=hist_kwargs,
       title_kwargs=title_kwargs,
       show_titles=True,
       quantiles=[0.16,0.5,0.84],
       title_fmt='.4f');
#     fig.tight_layout()

df=pd.DataFrame(fc)
df.columns = ['A','theta','phi','sigma']
df.describe()
def get_stats(sample,tol=4):
    '''
    return 50th, 16th, and 84th percentiles
    (median & 1 sigma limits) of a given sample
    '''
    l,m,r = np.percentile(sample,[16,50,84])

    return m, m-l, r-m
vals, uncs = [], []

for i in range(ndim):
    j=fc[:,i][taus[i]]
    d=get_stats(j)
    vals.append(d[0])
    uncs.append((d[1],d[2]))
    print('{:.6f} +{:.6f} -{:.6f}'.format((d[0]),d[1],d[2]))
# Plot the phased data & model
fig, ax = pl.subplots()

ax.plot(phase, f, '.k', alpha=0.5, label='data')
ax.plot(phase, h(phase, *vals[:3]), 'ro', lw=3, label='model')

ax.set(xlabel='Phase',
       ylabel='flux',
      title='Phase-folded light curve');
ax.legend()
